At the end of 2014, India’s courts had 102,208 cases of caste atrocities against Dalits still waiting for a verdict, the National Crime Records Bureau’s court table for that year shows. At the end of 2024 they had 339,853, the 2024 edition shows: 3.3 times as many. In the same ten years, the number of trials courts finished in a year barely moved, from 16,627 in 2014 to 16,973 in 2024.
Dalits are the communities once branded “untouchable” under the caste order; Indian law lists them as Scheduled Castes (SCs). The NCRB, the federal government’s crime-data agency, publishes their cases each year in Crime in India, its annual count of crime recorded by the police. Its tables track “atrocities”: crimes against SCs by people who are not SCs or Scheduled Tribes (STs, the legal category for Adivasi, or Indigenous, communities), registered under the Scheduled Castes and Scheduled Tribes (Prevention of Atrocities) Act, India’s 1989 law against caste violence.
Cases pending trial at year end, in thousands: 102,208 in 2014; 339,853 in 2024
Source: NCRB, Crime in India 2014–2024, court-disposal tables (Table 7.4 for 2014–2015, Table 7A.6 from 2016). Compiled by The Dalit Project.
The figures below run across eleven editions of those tables. For 2024 alone, state by state, see our analysis of the 2024 edition.
One case behind the numbers
On 13 January 2015, a sessions court (the district-level court that tries serious crimes) in Jehanabad district, in central Bihar in eastern India, acquitted all 24 people tried over the 1999 killing of Dalit villagers at Shankar Bigha, citing “lack of evidence”, the Dubai newspaper Gulf News reported. Reports put the dead at 23 or 22. The killings were allegedly carried out by members of the Ranvir Sena, an outlawed militia of landlords from castes ranked above Dalits, the Indian news agency IANS reported. The trial had lasted 16 years. According to reports cited by Gulf News, all 49 witnesses produced in court turned hostile.
“All these years, I had kept waiting for justice hoping the accused persons will be served harsh punishment; instead they have been acquitted. I am totally hopeless now,” Rajmani Devi, whose husband and three other relatives were killed, told Gulf News. Etwaria Devi, who lost her husband, told IANS: “There is no one to do justice to the poor like us. We have only pain and misery in our life.”
The NCRB’s court tables count verdicts like this one only as numbers in a column of acquittals. They record how many trials end and how, not why.
What the NCRB counts
Three counting rules shape every trend below.
It counts registered police cases. Each case counted is a registered First Information Report (FIR), the police complaint that opens a criminal case. “Only police recorded crime cases are being captured”, the bureau states. Under its “principal offence rule”, an FIR listing several offences is counted once, under the one that carries the heaviest punishment, it explains. A complaint the police never register is not in the data at all.
Its atrocity tables leave out cases filed only under the penal code. Since the 2016 edition, cases “under only IPC (without SC/ST Act)”, the Indian Penal Code, have been excluded, the footnote to Table 7A.1 says. The change is visible in the numbers. The 2014 edition counted 47,064 crimes against SCs, including penal-code cases without the Atrocities Act and cases under other laws, its Table 7.1 shows. The 2016 edition restated 2014 on the narrower basis as 40,401 cases. All the counts below use the narrower basis.
It publishes what the states send. The NCRB “is not responsible for authenticity” of state data, it says. The 2019 count shows what that can mean. The 2019 edition recorded 45,935 cases, but data from West Bengal, in eastern India, had not arrived in time, so the bureau reused West Bengal’s 2018 figure of 119, the table’s footnote says. The 2020 edition printed 145 for West Bengal in 2019 and a national total of 45,961. The difference between the two figures in circulation, 26 cases, is exactly the change in West Bengal’s figure (145 − 119). Both appear in later reporting; 45,961 is the revised figure.
Registered cases rose from 40,401 in 2014 to a peak of 57,789 in 2023, then fell to 55,698 in 2024, the 2024 edition shows. That 38% rise over ten years can mean more attacks, more complaints, or more complaints accepted by police, and the tables cannot separate the three. The National Campaign on Dalit Human Rights (NCDHR), founded in 1998 as “a national movement of Dalit human rights defenders, activists, academics, and civil society organizations”, in its own description, warns that atrocities are often underreported, and that “the officially recorded figures are likely to underestimate the true extent of the violence,” in its 2026 review of NCRB data. Lower figures in some states, it adds, could result from “refusal to register cases, rather than a genuine reduction in violence.”
The court figures raise a different question. Whatever drove registration, they show what the courts did with the cases police sent them.
Methodology
Source. NCRB, Crime in India, chapter 7 (crimes against Scheduled Castes), one edition per year, 2014 to 2024. Editions 2014 to 2021 were read from the individual table PDFs on ncrb.gov.in; 2022 and 2023 from copies of the NCRB volumes hosted by the OpenCity data portal (2022, 2023); 2024 from ncrb.gov.in.
Tables. Court disposal: Table 7.4 in the 2014 and 2015 editions (2014, 2015), using the row “Total of SC/ST (Prevention of Atrocities) Act”, which matches the basis later editions use; Table 7A.6 from 2016 (2016, 2017, 2018, 2019, 2020, 2021). Registered cases: Table 7A.1. Each year’s court figures come from that year’s own edition.
Conviction rate. Cases convicted ÷ cases in which trials were completed × 100, the NCRB’s definition. For example, 2014: 4,716 ÷ 16,627 = 28.4%. Recalculated from the counts, every year’s rate matches the NCRB’s printed rate.
Our calculations. Share of cases finished: trials completed ÷ all cases before the courts that year (2014: 16,627 ÷ 119,526 = 13.9%; 2024: 16,973 ÷ 357,009 = 4.8%). Years to clear the backlog: cases pending at year end ÷ cases the courts disposed of that year, with or without trial (2014: 102,208 ÷ 17,318 = 5.9; 2024: 339,853 ÷ 17,156 = 19.8). Acquittals: the 2014 to 2016 tables combine acquittals and discharges, so both are counted together for every year. Pooled rates add up convictions and finished trials across years before dividing (2014 to 2024: 49,580 ÷ 156,110 = 31.8%).
Limitations. Only police-recorded crime. The SC population used for NCRB crime rates is the 2011 census count. India’s new criminal code, the Bharatiya Nyaya Sanhita, replaced the penal code from 1 July 2024, and the NCRB revised its formats to match, Volume 1 of the 2024 edition notes. States “may not be compared purely on the basis of crime figures”, the NCRB warns.
Ten years of the court pipeline
Years to clear = cases pending at year end ÷ cases disposed of by courts that year. A Dalit Project calculation.
Source: NCRB, Crime in India 2014 (Table 7.4), 2016 (Table 7A.1, for 2014 registrations) and 2024 (Tables 7A.1, 7A.6). Compiled by The Dalit Project.
Police sent 29,327 cases to trial in 2014 and 45,023 in 2024, a 54% increase, the court tables for 2014 and 2024 show. The courts’ output did not follow. They finished between 12,000 and 17,000 trials in most years, with a low of 7,637 in 2020, the 2020 table shows, and a high of 20,297 in 2023. Every year, fewer cases left the courts than arrived.
The result is a queue that lengthens every year. In 2014, trials finished in 13.9% of the cases before the courts. In 2024, they finished in 4.8%. At 2014’s pace, the courts would have needed about six years to clear that year’s backlog if no new case arrived. At 2024’s pace, they would need about 20.
3.3 times: the growth in India’s court backlog of caste-atrocity cases between the end of 2014 (102,208) and the end of 2024 (339,853) — NCRB, Crime in India 2014, Table 7.4; 2024, Table 7A.6
A conviction rate that does not trend
Conviction rate, % of finished trials. 2020's 42.4% rests on 7,637 trials, the fewest of the period. Pooled 2014–2024: 31.8%.
Source: NCRB, Crime in India 2014–2024, court-disposal tables. Compiled by The Dalit Project.
i
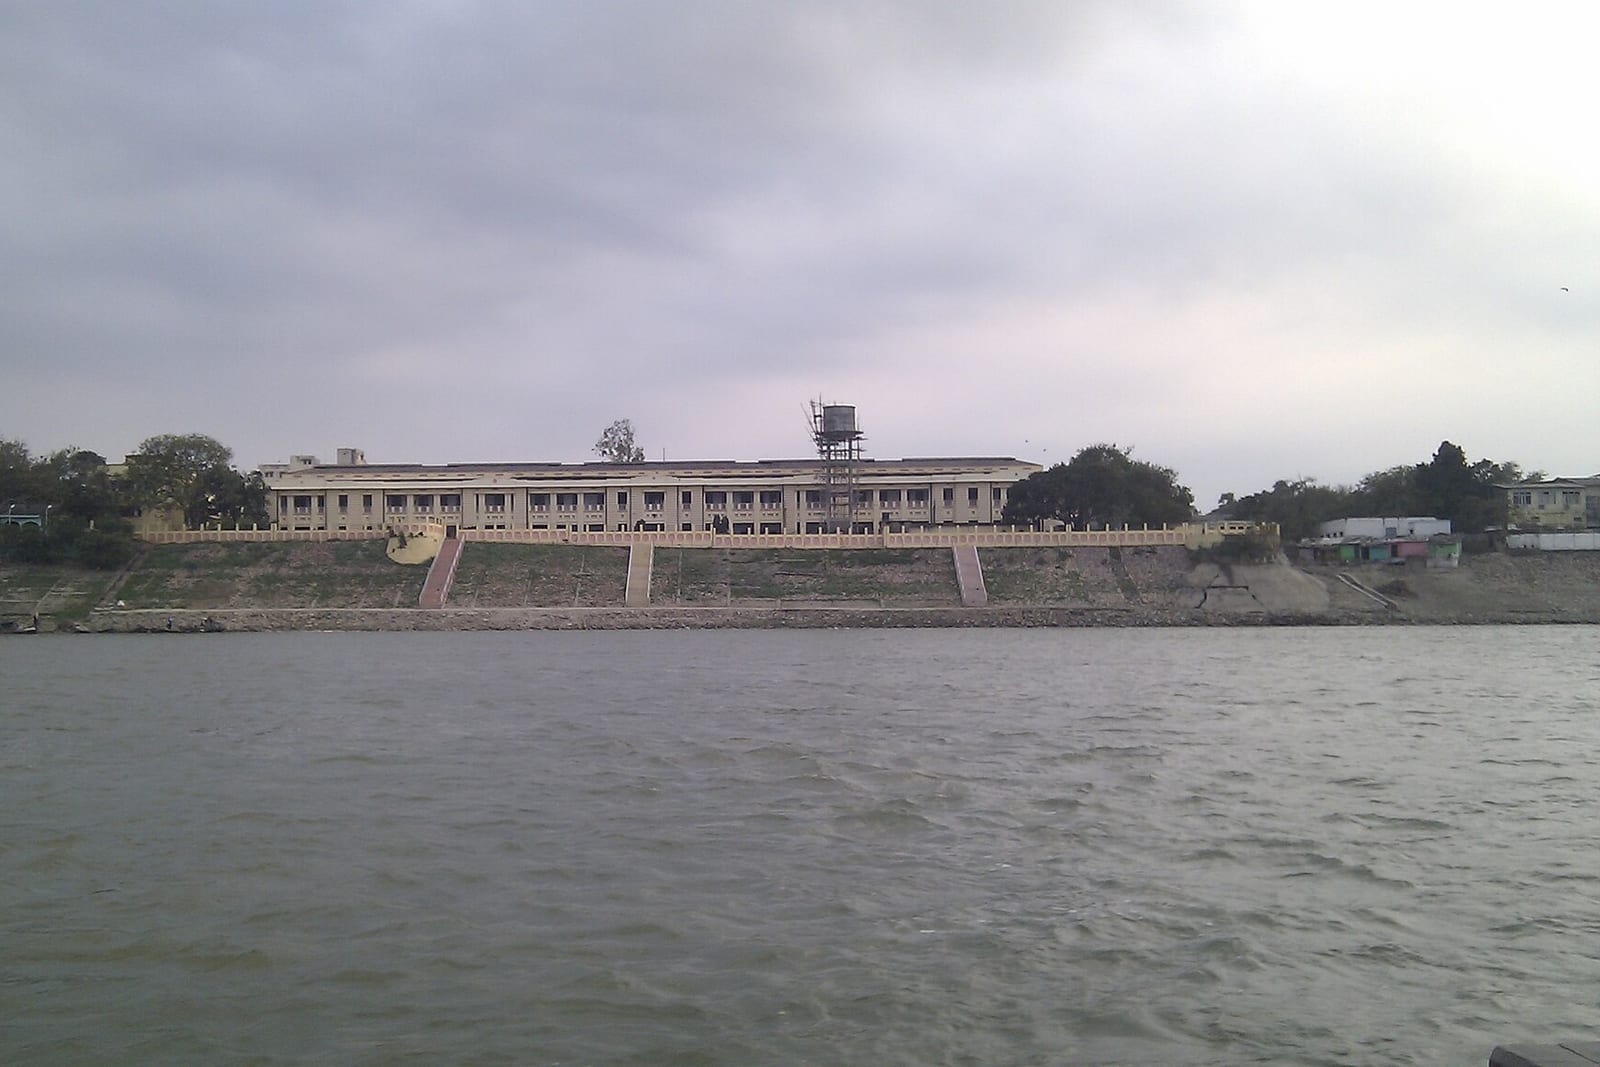
CC BY-SA 3.0Original on Wikimedia CommonsThe conviction rate was 28.4% in 2014 and 33.9% in 2024. In between it ranged from 25.7% in 2016 to 42.4% in 2020, the year courts finished the fewest trials. Pooled across the eleven years, 49,580 of 156,110 finished trials ended in conviction: 31.8%.
Acquittals and discharges (a court releasing an accused without a full trial verdict) outnumbered convictions in every year. In 2014, 11,911 trials ended in acquittal or discharge against 4,716 convictions, about two and a half to one, the 2014 table shows. In 2024 the figures were 11,216 against 5,757, about two to one, the 2024 table shows. Over the eleven years the totals were 106,530 against 49,580.
The NCDHR reads the same tables as a failure across the whole chain of a case:
“This widening gap between conviction and acquittal reflects the weakness of the justice delivery process at multiple levels from investigation and evidence gathering to prosecution and judicial scrutiny.” National Campaign on Dalit Human Rights, Five Years of Caste Based Atrocity (2026)
Where the gap sits
At the end of 2024, the ten largest court backlogs were in Uttar Pradesh, in the north; Bihar and Odisha, in the east; Madhya Pradesh, in central India; Rajasthan, in the north-west; Maharashtra and Gujarat, in the west; and Karnataka, Andhra Pradesh and Tamil Nadu, in the south, the 2024 court table shows.
| State | Cases pending trial at year end (2024) | Share decided (2024) | Convicted, of cases decided (2024) | 2016 (decided / convicted) |
|---|---|---|---|---|
| Uttar Pradesh | 4.4% | 73.3% | 7.7% / 55.8% | |
| Bihar | 1% | 36.1% | 4.1% / 18.1% | |
| Madhya Pradesh | 7.9% | 35.6% | 17.5% / 31.2% | |
| Rajasthan | 5% | 36.9% | 8.8% / 44.5% | |
| Odisha | 0.4% | 10.8% | 12.8% / 3.3% | |
| Maharashtra | 4.2% | 9.3% | 11.3% / 10.5% | |
| Gujarat | 5.6% | 5.4% | 6.1% / 4.6% | |
| Karnataka | 6.2% | 3.2% | 10.7% / 2.8% | |
| Andhra Pradesh | 10.9% | 2.4% | 27.2% / 3.2% | |
| Tamil Nadu | 8% | 11.9% | 19.4% / 7.7% |
'Share decided' = trials completed ÷ all cases before the courts that year. 'Convicted' = the NCRB conviction rate. NCRB: states 'may not be compared purely on the basis of crime figures'.
Source: NCRB, Crime in India 2016 and 2024, Table 7A.6. Compiled by The Dalit Project.
The state tables, available on the same basis from the 2016 edition, show the national rate is an average of very different courts. From 2016 to 2024, courts in Uttar Pradesh, in the north, convicted in 19,310 of 28,182 finished trials, 68.5%, and produced 47% of all convictions in India, Dalit Project calculations from the nine court tables from 2016 to 2024 show (each is linked in the methodology box above). In the rest of the country, 21,435 of 96,158 finished trials ended in conviction: 22.3%.
In the south and west, conviction is rare in every year. Over the same nine years, courts in Karnataka, Andhra Pradesh and Telangana, in the south, and Gujarat, in the west, recorded some of the lowest rates in India. Karnataka’s courts convicted in 205 of 6,652 finished trials (3.1%), Andhra Pradesh’s in 313 of 6,877 (4.6%), Gujarat’s in 169 of 3,684 (4.6%) and Telangana’s in 299 of 5,125 (5.8%). In Odisha, in the east, it was 111 of 2,712 (4.1%). In none of the nine years did Karnataka, Andhra Pradesh, Gujarat or Telangana convict in more than 11% of finished trials.
Bihar, in the east, rarely finishes a trial. Its courts completed 4,204 trials in nine years. Its backlog at the end of 2024 was 71,111 cases, up from 26,685 at the end of 2016, the 2016 and 2024 tables show. In no year since 2017 did it finish trials in more than 2% of the cases before its courts.
Backlogs grew in every one of the ten states. Odisha’s grew 3.4 times, Madhya Pradesh’s 3.2 times and Andhra Pradesh’s 3.1 times.
For Shankar Bigha’s families, the wait was 16 years. The NCDHR, writing of the five years to 2023, put the cost of such waits in one sentence:
“For Dalit survivors, this is not merely a matter of numbers it translates to years of waiting, social pressure, and an enduring sense of injustice.” National Campaign on Dalit Human Rights, Five Years of Caste Based Atrocity (2026)
What the data can’t tell us
Whether violence rose. The registered count measures what reached a police register. It rose by 38% from 2014 to 2024, but the tables cannot split that rise between more attacks and more registration.
Why trials end in acquittal. The tables record outcomes, not reasons. They don’t say whether witnesses turned hostile, as reports said they did at Shankar Bigha, whether the case had a special court or a special prosecutor, or whether the investigation was weak.
How long each case took. The chapter on crimes against SCs records how many cases are pending, not for how long.
Anything about the people involved. The counts are of cases, not of the people harmed or accused in them.
Data download
The figures behind these charts, for every state and union territory from 2016 and nationally from 2014, are on the Atrocity Justice tracker, with the NCRB table, column and source for each.
All crime figures are from the National Crime Records Bureau’s Crime in India, editions 2014 to 2024, read from the NCRB’s published tables. Shares of cases finished, years to clear the backlog, pooled rates and the rates without Uttar Pradesh are The Dalit Project’s calculations from those tables.