In 2024, India’s courts had 357,009 cases of crimes against Dalits before them, and they finished the trial in 16,973 of them: 4.8%, according to the NCRB’s Crime in India 2024, the annual count of police-recorded crime published by the federal government’s crime-data agency in May 2026, The Wire reported. Dalits are the communities once branded “untouchable” under the caste order; Indian law lists them as Scheduled Castes (SCs). Nearly all the rest, 339,853, were still pending when the year ended, the NCRB’s court-disposal table shows.
Conviction rate in NCRB terms (convictions ÷ trials completed) was 33.9%. As a share of all cases before the courts, convictions were 1.6%.
Source: NCRB, Crime in India 2024, Vol. 2, Table 7A.6. Compiled by The Dalit Project.
That is the conviction gap in its plainest form. The headline conviction rate, 33.9%, describes only the small share of cases that reached the end of a trial. Those 16,973 finished trials ended in 5,757 convictions, 10,679 acquittals and 537 discharges, Table 7A.6 shows. For the other 340,036 cases before the courts, the year ended without a verdict of any kind: 183 were closed without a trial, most of them quashed or abated, the same table records, and 339,853 were still pending.
Why the number matters
The Scheduled Castes and Scheduled Tribes (Prevention of Atrocities) Act, India’s 1989 law against caste violence, “was enacted to provide enhanced legal protection to communities historically subjected to exclusion and violence”, as the National Campaign on Dalit Human Rights (NCDHR) puts it. The NCRB’s tables count those cases: “atrocities”, in its definition, are crimes committed against SCs by people who are not SCs or Scheduled Tribes (STs, India’s legal category for Adivasi, or Indigenous, communities), and cases booked under the ordinary penal code alone, without the Atrocities Act, are left out, its footnote to Table 7A.1 says.
Police registered 55,698 such cases in 2024, down 3.6% from 57,789 in 2023, after 57,582 in 2022, Table 7A.1 shows. That is 27.7 cases for every 100,000 Dalits. Each one began as a First Information Report (FIR), the police complaint that opens a criminal case, registered against an accused from outside the Scheduled Castes and Tribes.
What happens next is the part the data measures best. Police sent 45,023 cases to court in 2024, Table 7A.4 shows. Courts finished 16,973 trials. The court backlog grew by 27,867 cases in a year, from 311,986 at the start of 2024 to 339,853 at the end, Table 7A.6 shows. At 2024’s pace of 17,156 cases disposed of by the courts, clearing the cases already pending would take about 20 years even if no new case were filed, a Dalit Project calculation from the same table.
339,853 cases of crimes against Scheduled Castes still awaiting a verdict at the end of 2024, 95.2% of all such cases before the courts that year — NCRB, Crime in India 2024, Table 7A.6
The convictions that do come mostly judge old cases. Of the 5,757 convictions in 2024, 5,024 were in cases sent to court in earlier years, Table 7A.6 shows. Acquittals outnumbered convictions nearly two to one: 10,679 against 5,757.
How to read these numbers
Methodology
Source. National Crime Records Bureau, Crime in India, Volume 2, Chapter 7 (crime against Scheduled Castes), editions for 2024 (ncrb.gov.in), 2023 and 2022 (NCRB PDFs as hosted by the OpenCity data portal; the 2024 copy there is byte-identical to NCRB’s own). Table 7A.1: cases registered, rate, charge-sheeting rate. Table 7A.4: police disposal, state-wise. Table 7A.6: court disposal, state-wise. Each edition covers one calendar year, 1 January to 31 December.
Conviction rate. In NCRB terms, cases convicted divided by cases in which trials were completed, times 100, Volume 1 states. It is not the share of registered cases, or of cases before the courts, that end in conviction.
Charge-sheeting rate. Cases in which police filed a charge sheet (the document that sends a case to trial) divided by all cases police disposed of that year, by the same definition. Cases still under investigation are left out of the denominator.
Pendency. Cases pending at year end divided by all cases before police (or courts) that year, as the footnotes to Table 7A.4 and Table 7A.6 define it.
Rates. NCRB gives rates “per lakh”; a lakh is 100,000, so the figures here are per 100,000 people. For SCs, the denominator is the 2011 census count of the SC population, Table 7A.1 notes, so rates rest on a population figure now 13 years older than the crimes.
Limitations. The NCRB counts only police-recorded crime and says it is “not responsible for authenticity” of data the states supply, Volume 1 states. Under the “principal offence rule”, an FIR listing several offences is counted once, under the most serious, the bureau explains; that shifts the split between offence types, which is not used here, while each case is still counted once. Unreported crimes are not in the data at all. India’s new criminal code, the Bharatiya Nyaya Sanhita (BNS), replaced the Indian Penal Code from 1 July 2024, and the NCRB revised its collection formats to match, recording cases registered under the old and new codes separately but tabulating police and court disposals together “to ensure better representation/comparability and consistency of the data”, Volume 1 notes. Registration counts for 2024 may still not be strictly comparable with earlier years. The NCRB itself warns, under each state table, that states “may not be compared purely on the basis of crime figures.”
Three years, one direction
2023: 311,986 pending; 6.1% of cases with a finished trial; conviction rate 31.9%; charge-sheeting rate 81.2%.
Source: NCRB, Crime in India 2022, 2023 and 2024, Vol. 2, Tables 7A.1 and 7A.6. Compiled by The Dalit Project.
The court backlog grew every year: 283,589 cases pending at the end of 2022, up from 254,476 a year earlier, 311,986 at the end of 2023 and 339,853 at the end of 2024, from the 2022 and 2024 editions. The conviction rate went from 34.0% to 31.9% to 33.9%. Court pendency went from 94.4% to 93.8% to 95.2%.
The police side improved slightly. The charge-sheeting rate rose from 79.9% in 2022 to 81.2% in 2023 and 82.0% in 2024, each edition’s Table 7A.1 shows. Police ended 2024 with 17,164 cases still under investigation, 23.8% of their caseload, against 16,454 a year earlier and 19,090 at the end of 2022, Table 7A.4 and its 2023 counterpart show. Police are sending a slightly larger share of the cases they close to court. Courts finished 16,538 trials in 2022, 20,297 in 2023 and 16,973 in 2024, each year fewer than half of the 45,827, 49,017 and 45,023 cases police sent to them, the court tables for 2022, 2023 and 2024 show.
Where the gap is widest
| State | Cases pending trial at year end (2024) | Share decided (2024) | Convicted, of cases decided (2024) | 2023 (decided / convicted) |
|---|---|---|---|---|
| Uttar Pradesh | 4.4% | 73.3% | 5.1% / 65.6% | |
| Bihar | 1% | 36.1% | 0.9% / 30.1% | |
| Madhya Pradesh | 7.9% | 35.6% | 11.5% / 21.6% | |
| Rajasthan | 5% | 36.9% | 10.2% / 61.4% | |
| Odisha | 0.4% | 10.8% | 2.5% / 0.4% | |
| Maharashtra | 4.2% | 9.3% | 5.7% / 8.9% | |
| Gujarat | 5.6% | 5.4% | 4.3% / 7.4% | |
| Karnataka | 6.2% | 3.2% | 9% / 2.2% | |
| Andhra Pradesh | 10.9% | 2.4% | 9.9% / 3.1% | |
| Tamil Nadu | 8% | 11.9% | 11.9% / 12.2% |
'Share decided' here = trials completed ÷ all cases before the courts that year. Odisha finished only 102 trials in 2024 and 541 in 2023, so its conviction rates swing on small numbers. NCRB: states 'may not be compared purely on the basis of crime figures'.
Source: NCRB, Crime in India 2023 and 2024, Vol. 2, Table 7A.6. Compiled by The Dalit Project.
Five states, Uttar Pradesh in the north, Madhya Pradesh in central India, Bihar in the east, Rajasthan in the north-west and Maharashtra in the west, recorded 40,183 of the 55,698 cases in 2024, 72%, Table 7A.1 shows. Measured against each state’s Dalit population, the heaviest burden is in Madhya Pradesh (68.5 cases per 100,000), Rajasthan (57.3), Bihar (45.6), Telangana, in the south (37.9), and Odisha, in the east (37.6). (Mizoram, in the north-east, shows 164.2, from two cases in a very small SC population.)
Uttar Pradesh registered 14,642 cases, more than any other, and convicted in 73.3% of finished trials, the court table shows. Its 3,150 convictions are 55% of the national total. Take Uttar Pradesh out and India’s conviction rate for 2024 is 20.6%, and it was 22.1% in 2023 and 19.6% in 2022, Dalit Project calculations from the 2024, 2023 and 2022 court tables. Even in Uttar Pradesh, trials finished in only 4.4% of the 97,986 cases before its courts.
Bihar has the second-largest backlog. Of 71,837 cases before its courts in 2024, trials finished in 726, or 1.0%, and 99.0% were still pending at year end, Table 7A.6 shows. Its police ended the year with 42.5% of their cases still under investigation, Table 7A.4 shows.
Among states that finished more than 750 trials, the south and west convict least. In finished trials, the conviction rate was 2.4% in Andhra Pradesh, 3.2% in Karnataka and 3.7% in Telangana, all in the south, and 5.4% in Gujarat and 9.3% in Maharashtra, in the west, the court table shows. Each of these states finished between 792 and 1,068 trials, so each rate rests on hundreds of verdicts. In Andhra Pradesh, Karnataka and Telangana the rate has stayed below 5% in all three editions.
i
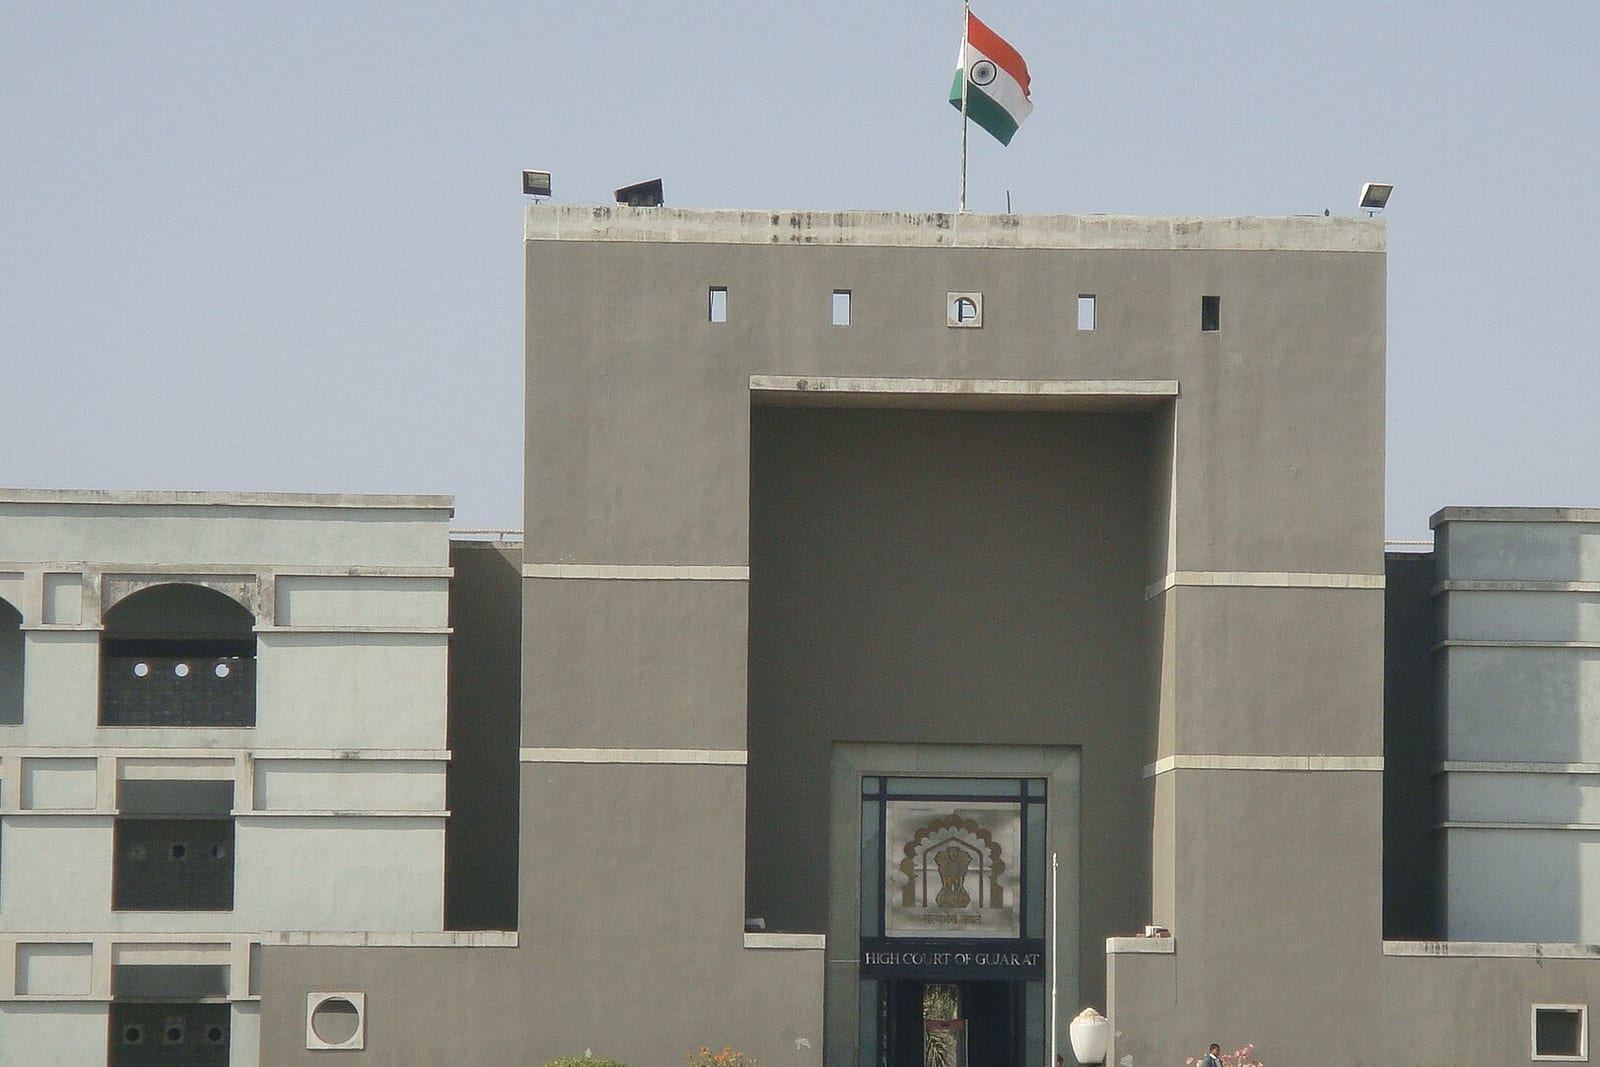
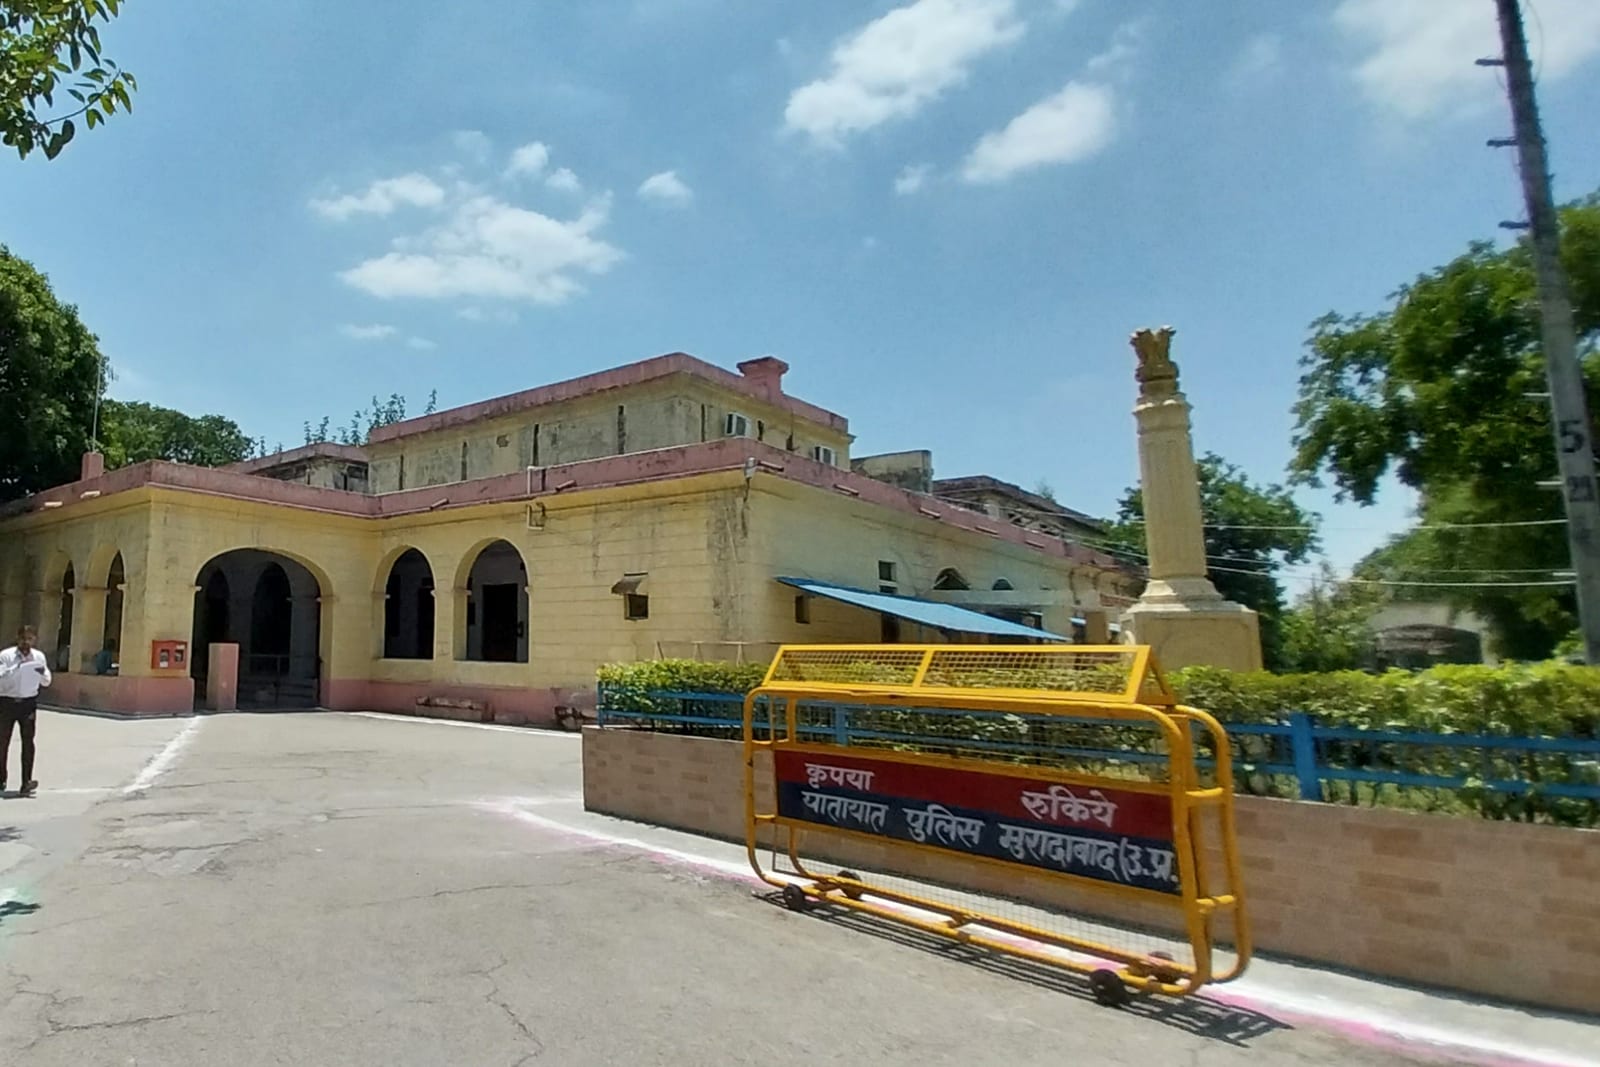
CC BY-SA 4.0Original on Wikimedia CommonsIn Rajasthan, the police-stage figures stand out. Its police sent 43.9% of the cases they closed to court, the lowest charge-sheeting rate of any state that registered more than 1,000 cases, Table 7A.4 shows. Of 7,491 cases its police disposed of, 3,676 were closed with a “final report false”, the police’s own conclusion that the complaint was untrue, the same table records. That is 61% of the 6,055 such closures in India. Rajasthan’s conviction rate in finished trials swung from 39.5% in 2022 to 61.4% in 2023 and 36.9% in 2024.
Satish Kumar, director of the Dalit Adhikar Kendra, a Dalit rights centre in Jaipur, Rajasthan’s capital, has pointed to prosecution. Some of the state’s special courts for atrocity cases use advocates chosen on the recommendation of political parties, who are “neither trained nor accountable”, he told Newslaundry in 2023. “Due to this, there is no proper representation in matters of discrimination and the accused are acquitted by courts,” he said. “This is why there are low conviction rates.” In the same report, Smita Srivastava, the state police’s additional director general for civil rights, said that since 2019 officers had been given “a compulsory course and exam training so that the strength of investigative officers in our police department increases.” The report carries no response from the state government or its law department on how the special courts’ advocates are chosen.
What the gap means
The NCDHR, a national movement of Dalit human rights defenders founded in 1998, read the 2023 edition of these tables in its February 2026 report on five years of atrocity data. Its conclusion on the court backlog:
“Such massive pendency weakens evidence, increases the risk of witness intimidation, and prolongs trauma for survivors.” National Campaign on Dalit Human Rights, Five Years of Caste Based Atrocity (2026)
“High acquittals point to poor investigation, weak prosecution, and systemic failure to protect victims,” the same report says. It calls for more exclusive special courts, “improved police accountability, and targeted legal support for survivors.”
Behind each of the 339,853 pending cases is a complaint to the police that is still waiting for a court’s answer. On the NCDHR’s reading, the longer that wait, the weaker the evidence.
What the data can’t tell us
Whether violence rose or fell. The 3.6% fall in registrations in 2024 could mean fewer attacks, fewer complaints accepted, or the change of criminal code in mid-year. Across all crime, the NCRB attributed a fall in registered “hurt” cases to the new code, under which simple hurt no longer appears in police registration data, The Wire reported. The Wire’s report cites no NCRB explanation specific to crimes against SCs.
How much goes unrecorded. The preface to the NCDHR report, signed by Beena Pallical, its general secretary, says “the actual incidence of caste-based atrocities against Scheduled Castes and Scheduled Tribes is much higher than what is reflected in official records”. The NCRB counts only what police record.
Why a case ends in acquittal. The tables record outcomes, not reasons: not whether witnesses turned hostile, whether a special court or a special prosecutor existed, or how long each case took.
Whether a “false” closure was false. A final report marked false is the police’s conclusion at the end of an investigation, not a court’s finding. The data cannot separate complaints that were untrue from investigations that were weak.
Anything about people rather than cases. These figures count registered FIRs, Volume 1 notes, not the people accused or harmed in them.
Data download
The full dataset behind these charts, 2,340 rows covering every state and union territory (a region governed directly by the federal government) for 2022, 2023 and 2024, 20 measures each, with the NCRB table, column and PDF page for every figure, is the first release of the Atrocity Justice tracker. Download it from the tracker page.
All figures are from the National Crime Records Bureau’s Crime in India 2022, 2023 and 2024 (Volume 2, Chapter 7), read from the NCRB’s published tables; shares, the Uttar Pradesh-excluded conviction rates and the backlog-clearance estimate are The Dalit Project’s calculations from those tables.